


ClubFootPrint: Advanced Volume Profile and Delta Analysis Indicator.
ClubFootPrint is a professional-grade indicator designed to deeply analyze market data,
enhance trading strategies, and optimize decision-making.
📊 Volume Profile and Delta Analysis
Volume Profile:
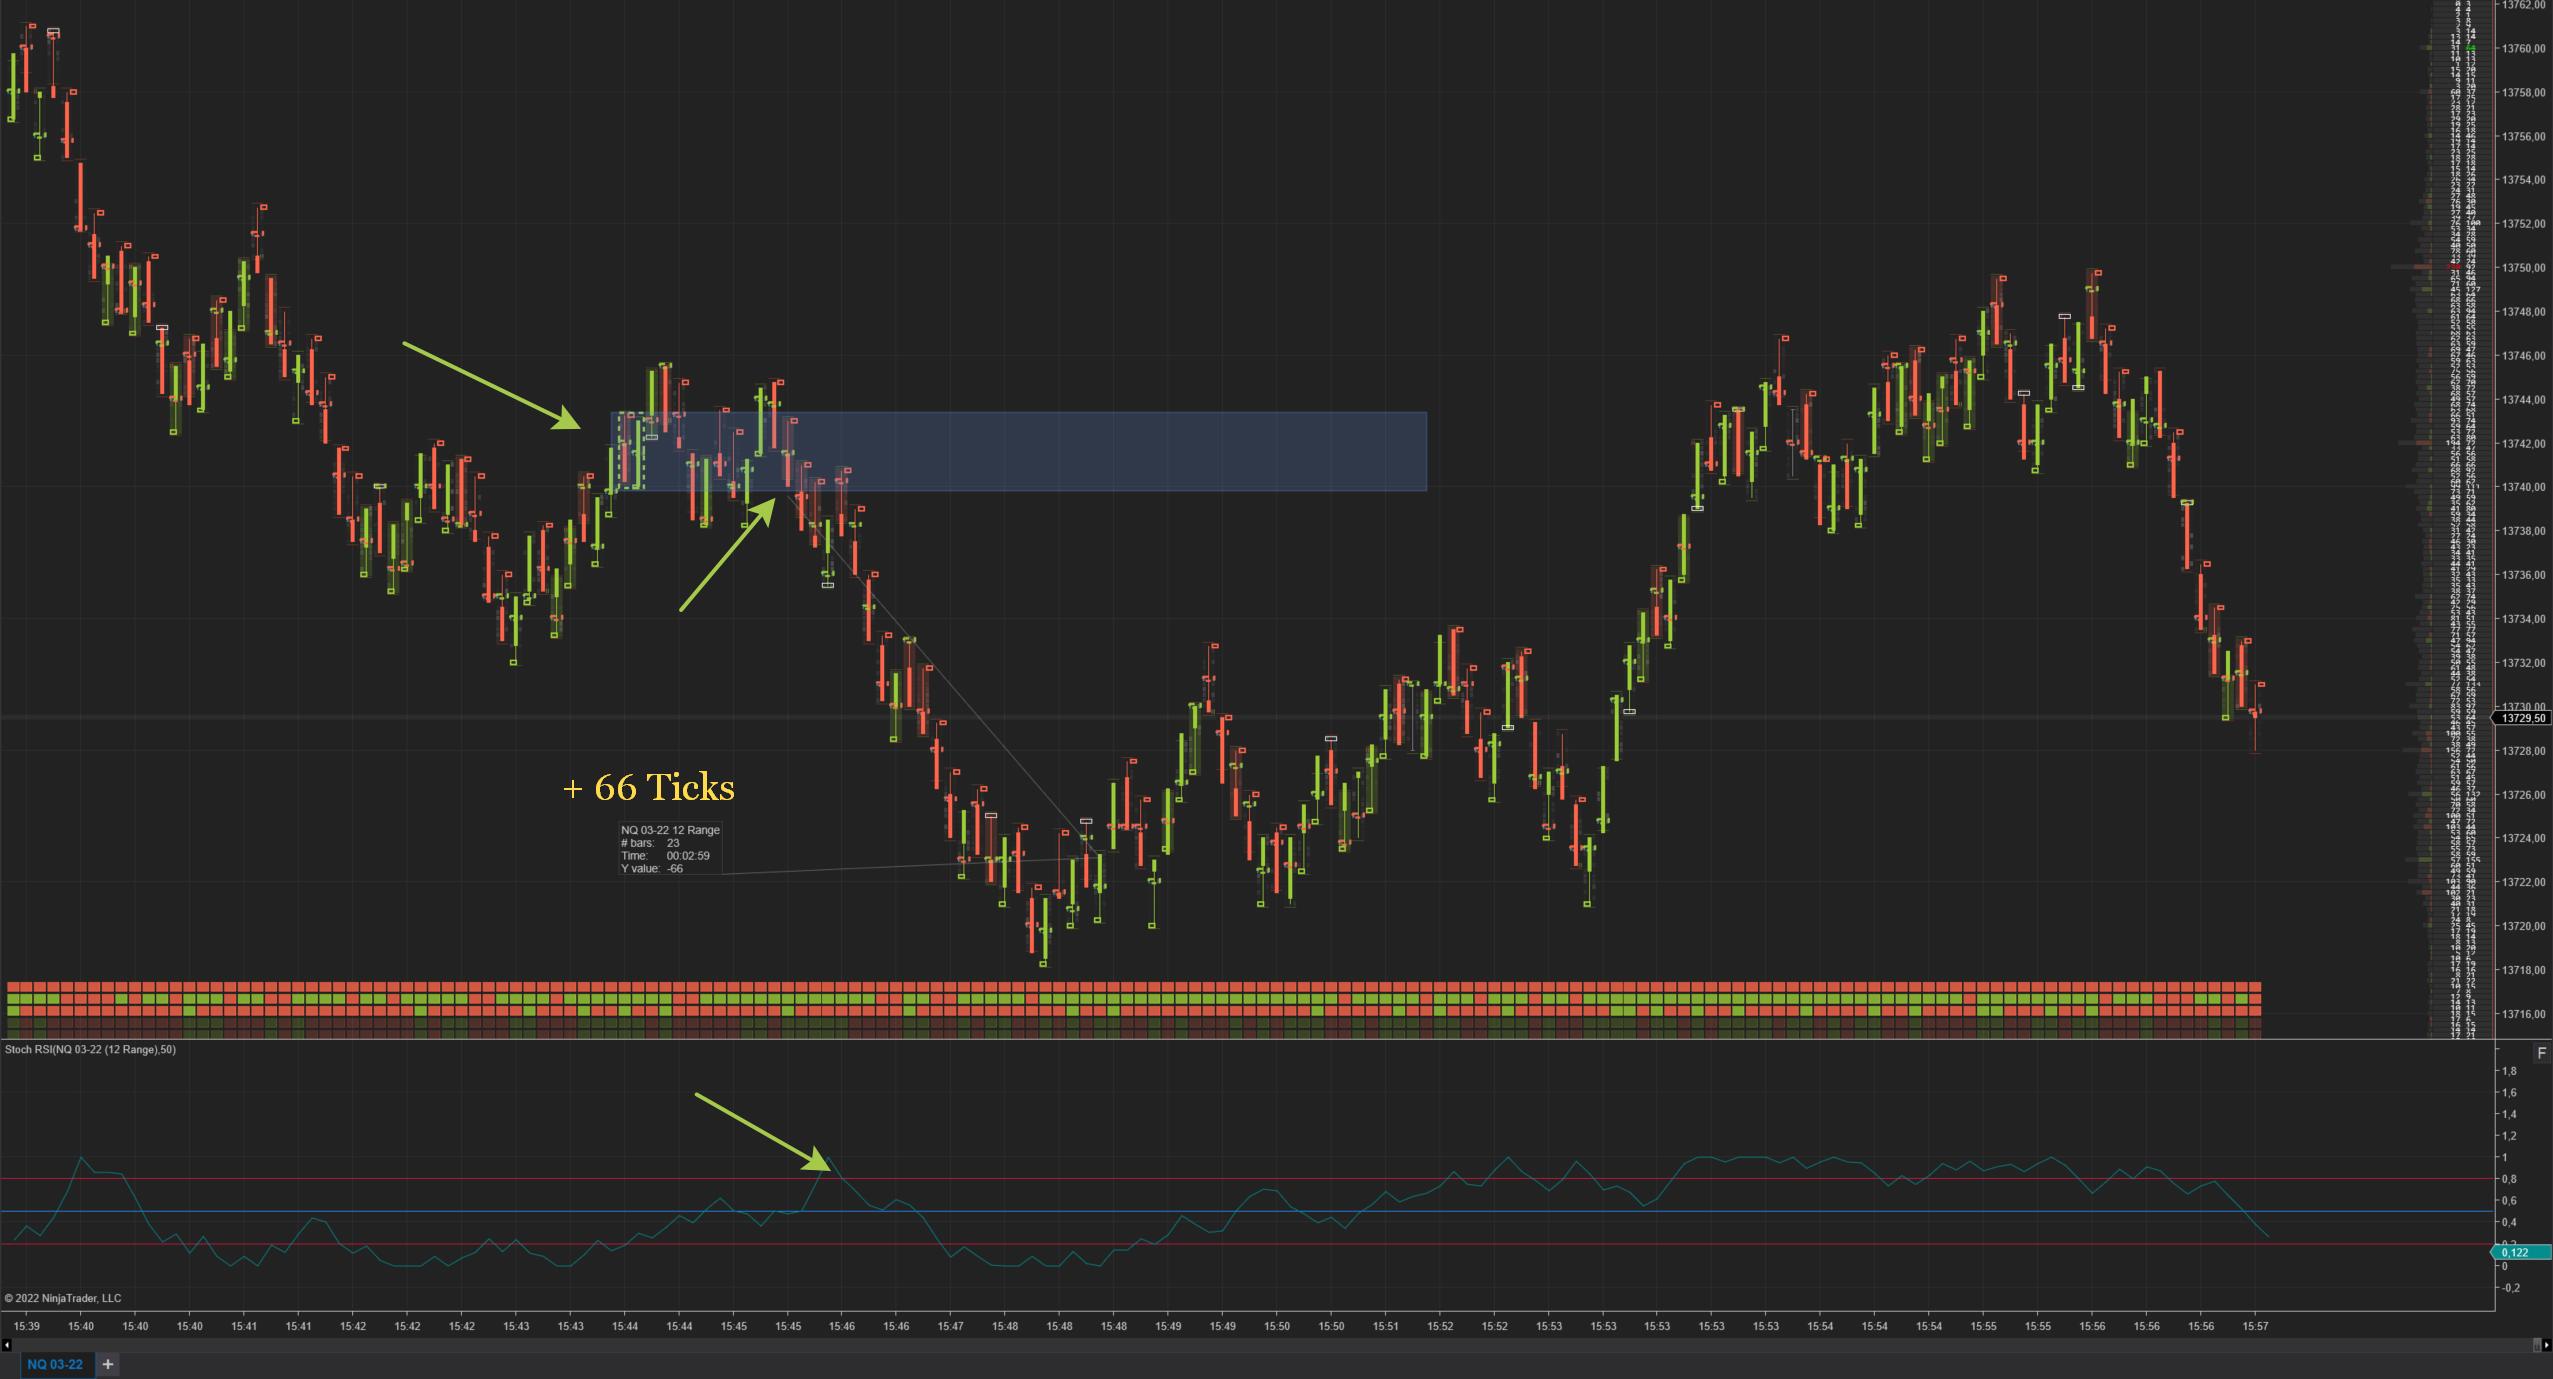
Displays total trading volume at each price level in a detailed manner. This allows you to easily identify support and resistance levels. Understanding where the most trading activity occurs gives you a significant advantage in predicting future market movements.
Delta Analysis:
Calculates the difference between bid (sell) and ask (buy) volumes to analyze market balance. Delta analysis helps you determine whether buyers or sellers are in control of the market, making it essential for identifying trends and potential reversals.
Who Should Use ClubFootPrint?
👶 Beginners:
Ideal for those looking to understand market data and develop trading strategies. The visualization features make it easy to learn market dynamics.
💼 Professional Traders:
Perfect for experienced traders who want to conduct in-depth market analysis and optimize their strategies. Advanced features like delta analysis and volume profiles provide valuable insights for professional decision-making.
📊 High-Frequency Traders:
Designed for those who need to make quick decisions and monitor the market in real-time. Features like real-time analysis and auto-scroll help you stay ahead of market changes.
Advantages of Using ClubFootPrint
✅ Detailed Analysis:
Analyze market data down to the smallest detail and shape your strategies accordingly.
✅ Visualization:
Simplify complex market information with clear and intuitive visualizations.
✅ Flexibility:
Customize the indicator to match your trading style and strategy.
✅ Efficiency:
Quickly analyze critical market information, saving you time and effort.
✅ Optimized Performance:
Achieve effective results in both volatile and stable market conditions.
Conclusion:
ClubFootPrint sets a new standard in market analysis with its powerful and flexible features. By providing detailed insights into market data, it helps you optimize your trading strategies and make informed decisions. Whether you’re a beginner or a professional trader, ClubFootPrint is the ultimate tool to elevate your trading performance.
📩 Contact us now and start improving your trading quality with ClubFootPrint!
## Why Choose Club Foot Print?
– **Unique Design**: Developed with 2602 lines of proprietary software code, Club Foot Print offers a different approach from other footprint indicators in the market.
– **Superior Performance Across All Pairs**: Extensive testing has proven that Club Foot Print produces consistent and reliable results across all forex pairs.
– **Customized Template**: Coming with its own unique template, the indicator ensures easy adaptation for traders of all levels thanks to its user-friendly interface.
– **Tick Replay Compatibility**: Working with advanced tick replay settings, Club Foot Print performs flawlessly even when analyzing historical data.
## Advantages of Club Foot Print
1. **Precise Market Depth Analysis**: By visualizing buyer and seller volumes in detail, it reveals the true strength of the market.
2. **Early Detection of Trend Reversal Points**: Thanks to its powerful algorithm, it allows you to spot potential trend changes before your competitors.
3. **Risk Management**: By clearly showing market liquidity and volatility, it helps you make more informed stop loss and take profit decisions.
4. **Time Saving**: By presenting complex data in an understandable format, it shortens your analysis time and allows you to make faster decisions.
📈 Performance and Speed
Real-Time Analysis:
Processes and analyzes market data in real-time, enabling you to react quickly to market changes.
Optimized Performance:
Delivers effective results in both volatile and stable market conditions.
How Does ClubFootPrint Work?
Data Collection:
Collects bid and ask volumes, price levels, and delta differences.
Processes this data in real-time for immediate analysis.
Visualization:
Displays volume profiles, delta analysis, POC, and imbalance ratios in a detailed graphical format.
Highlights delta changes and volume intensity in an intuitive interface.
Analysis and Strategy Development:
Analyze bid and ask imbalances to identify market trends.
Optimize entry and exit points using delta changes and volume profiles.
Customization and Filtering:
Fully customizable to suit your trading style and market conditions.
Filter specific volume levels or delta changes to focus on key data.